Overview
“sar” command supports generating different types of reports on fly and these reports can be exported as well. In this guide we will explain sar command execution with various attributes.
SAR will collate and give information about below;
- Block Device Statistics
- Paging Statistics
- Swap Statistics
- CPU Utilization Statistics
- Memory Utilization Statistics
- Interrupt Statistics
- Network Statistics
- Power Management Statistics
- Report I/O Statistics
- Report hugepages utilization statistics
SAR – Reports Generation
One of the main purpose “SAR” package is to generate System activity reports on fly and export those reports in different format.SAR Command – Syntax
sar -[Options] [Interval] [Iteration Count]sar -[Options] -s [hh:mm:ss] -e [hh:mm:ss] [Interval] [Iteration Count]
sar -o [Output filename] [interval] [Iteration Count] > /dev/null 2>&1 &
SAR Command – Examples
| SAR Command | Purpose |
|---|---|
| sar -r 10 5 | Memory utilization statistics every ten seconds for 5 times. |
| sar -r -s 10:00:15 -e 10:15:00 | Memory utilization statistics report between specific timeframe. |
| sar -o /tmp/mem_stats -r -u 2 5 >/dev/null 2>&1 & | Memory utilization statistics into output file. |
CPU Utilization Statistics
To generate CPU Utilization statistics, run the command;sar -u
sar -u [ALL] 2 2

Note: The above command will run 2 times for CPU utilization statistics every 2 seconds. “ALL” represents all CPU related fields should be shown.
Memory Utilization Statistics
To generate CPU Utilization statistics, run the command;sar -r
sar -r 2 2

Note: The above command will run 2 times for Memory utilization report every 2 seconds.
Block Device Statistics
To generate block devices statistics, run the command;sar -d
sar -d 2 2

Note: The above command will run 2 times for each Block Device(s) report every 2 seconds.
Hugepage Utilization Statistics
To generate hugepage utilization statistics, run the command;sar -H
sar -H 2 2

Note: The above command will run 2 times for huge pages info every 2 seconds.
Interrupt Statistics
To generate interrupt statistics, run the command;sar -I 15 2 2
sar -I SUM 2 2
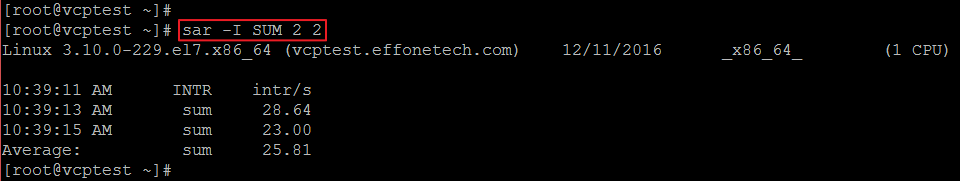
Note: The above command will run 2 times for all interrupts report every 2 seconds.
Network Statistics
To generate network statistics, run the command;sar -n DEV 2 2
sar -n [options] 2 2

Network Statistics Options
| Option | Purpose |
|---|---|
| DEV | Network interfaces |
| EDEV | Network interfaces (errors) |
| NFS | NFS client |
| NFSD | NFS server |
| SOCK | Sockets (v4) |
| IP | IP traffic (v4) |
| EIP | IP traffic (v4) (errors) |
| ICMP | ICMP traffic (v4) |
| EICMP | ICMP traffic (v4) (errors) |
| TCP | TCP traffic (v4) |
| ETCP | TCP traffic (v4) (errors) |
| UDP | UDP traffic (v4) |
| SOCK6 | Sockets (v6) |
| IP6 | IP traffic (v6) |
| EIP6 | IP traffic (v6) (errors) |
| ICMP6 | ICMP traffic (v6) |
| EICMP6 | ICMP traffic (v6) (errors) |
Kernel, INode and File Statistics
To generate inode, file and other kernel table statistics, run the command;sar -v 2 2

Swap Space Utilization Statistics
To generate swap space utilization statistics, run the command;sar -S
sar -S 2 2

Note: The above command will run 2 times for swap usage info report every 2 seconds.
I/O Statistics
To generate input/output (I/O) statistics, run the command;sar -b
sar -b 2 2

Note: The above command will run 2 times for I/O transfer rates info every 2 seconds.
Paging Statistics
To generate paging statistics, run the command;sar -B
sar -B 2 2

Note: The above command will run 2 times for paging usage info report every 2 seconds.
Run Queue Length and Load Average Statistics
To generate queue length and load averages statistics, run the command;sar -q
sar -q 2 2

Note: The above command will run 2 times for load & queue usage info report every 2 seconds.
| Field | Purpose |
|---|---|
| runq-sz | Run queue length (number of processes waiting for run time). |
| plist-sz | Number of processes and threads in the process list. |
| ldavg-1 | System load average for the last minute. |
| ldavg-5 | System load average for the past 5 minutes. |
| ldavg-15 | System load average for the past 15 minutes. |
Swap Space Utilization Statistics
To generate swap space utilization statistics, run the command;sar -S
sar -S 2 2

SAR Report – Write Output File
To store “sar” report to a data file, data file is stored in binary format and can be read by sar command, to store the report/data into a file run the command;sar -o /tmp/cpu_utilization_output_file -u 2 5 >/dev/null 2>&1 &

SAR Report – Read Output File
To read “sar” data file, run the command;sar -f /tmp/cpu_utilization_output_file

SAR Report – Read Specific Day Report
All the data files are stored in the directory “/var/log/sa/” by default it's configured for 28 days. In order to read a specific day’s report, run the command;sar -f /var/log/sa/saXX
sar -f /var/log/sa/sa10

Note: Day of the month is represented by saXX, where xx means day of month.
SAR Report – Read Specific Day and Time Report
All the data files are stored in the directory “/var/log/sa/” by default it’s configured for 28 days. In order to read a specific day and time report, run the command;sar -f /var/log/sa/saXX -s 21:00:00 -e 22:00:00
sar -f /var/log/sa/sa10 -s 21:00:00 -e 22:00:00

Note: Day of the month is represented by saXX, where xx means day of month.
Slideshare Information
Step by step document with screenshots is uploaded to slideshare.
This is very concise and useful. I encourage all system admins and DBAs to make use of this.
ReplyDelete